Research Infographics
Citation-verified visual knowledge. Every data point traces to a verified source.
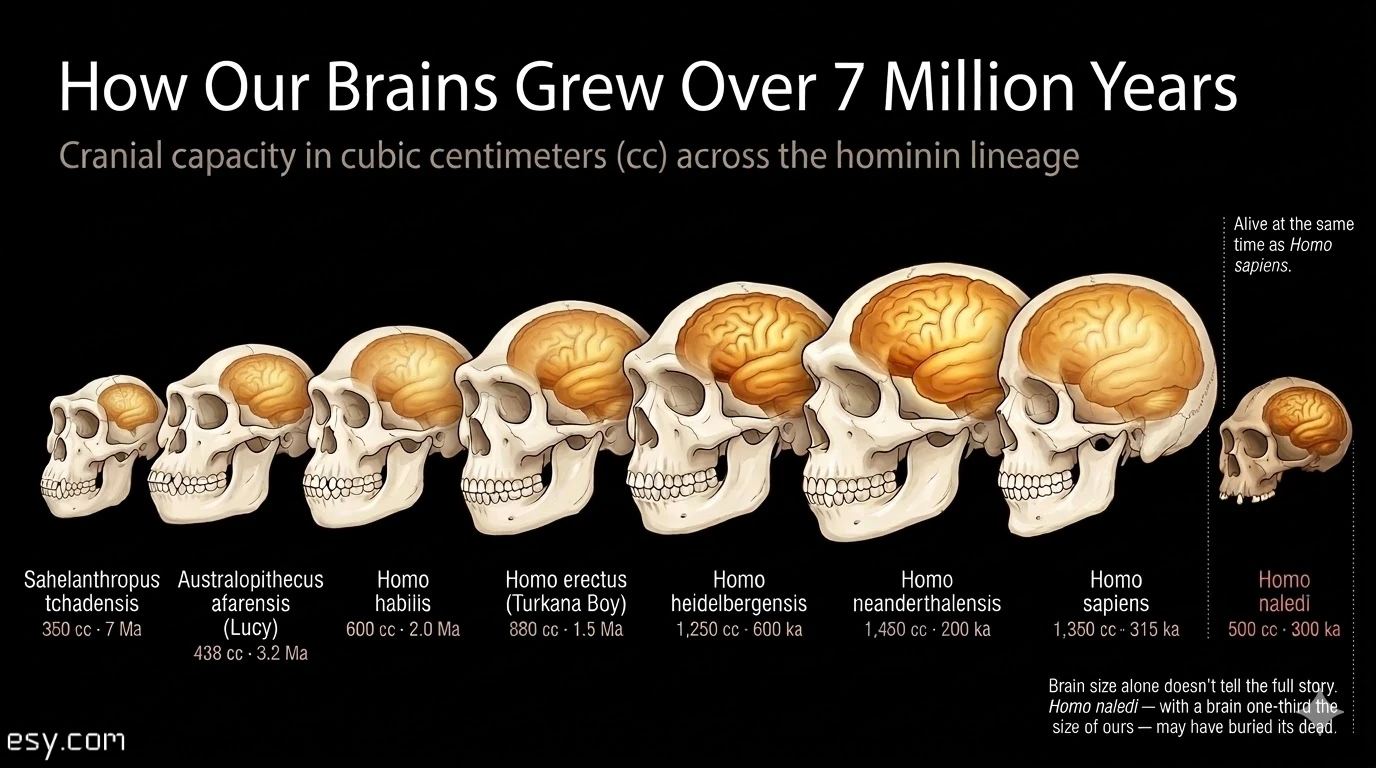
How Our Brains Grew Over 7 Million Years
Cranial capacity comparison across 8 hominid species — from Sahelanthropus tchadensis (350 cc) to Homo sapiens (1,350 cc), with Homo naledi as the outlier that challenges the linear growth narrative.
View InfographicMore research infographics in development. Each piece is citation-verified and designed to make complex knowledge accessible.